📊 3 Reporting Methods and When to Use Them...
/In today's data-driven world, reporting plays a crucial role in decision-making and data analysis for businesses of all sizes. Various reporting methods exist, each catering to specific needs and preferences. In this article, we will classify and explain when to use three popular reporting methods: Google Sheets, Hex, and Production Reporting Tools like PowerBI, Tableau, and QlikView.
1️⃣ Google Sheets / Excel (light):
Google Sheets and Excel are versatile tools that excel in nimble calculations and in capturing stakeholder input. They are ideal for small to medium-sized datasets that do not require complex data visualization. These spreadsheet-based solutions allow users to manipulate data, perform calculations, and collaborate with stakeholders in real-time.
When to use:
Quick data analysis: For ad-hoc analysis and swift calculations, Google Sheets and Excel are excellent choices. They provide a familiar interface for users to work with data efficiently.
Stakeholder collaboration: When multiple stakeholders need to contribute and provide input on the data, these tools facilitate seamless collaboration—especially when capturing requirements for more robust reports.
Simple reporting: For basic data presentation and sharing, especially in internal meetings or informal settings, Google Sheets and Excel serve the purpose well.
2️⃣ Hex Notebooks (efficient):
Hex is a low-lift reporting tool designed to provide stakeholders with direct access to the database. It includes dynamic parameters for filtering and segmentation, making it an attractive option for users who require some level of self-service reporting.
When to use:
Ad-hoc queries: Hex is suitable for users who need to run one-time or occasional queries without the need for complex visualization or recurring reports.
Self-service reporting: For organizations that prefer stakeholders to directly access and explore the data, Hex offers an intuitive way to interact with the database without relying on IT or analysts.
Limited technical expertise: Hex's user-friendly interface makes it accessible to users with limited technical knowledge, reducing the burden on the IT team.
3️⃣ Production Reporting Tools (scalable):
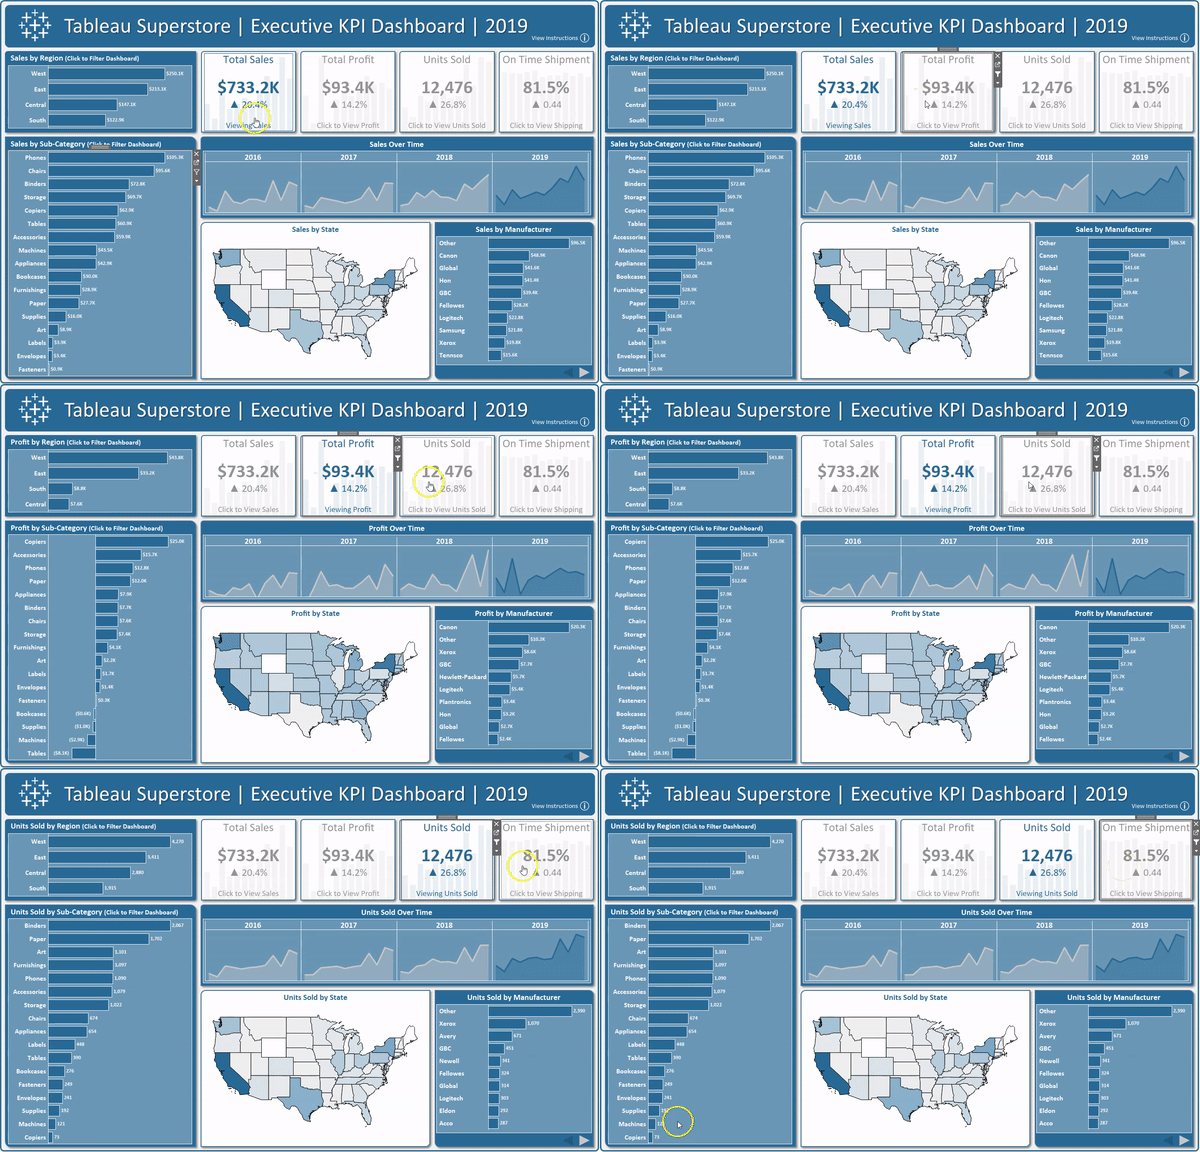
Production reporting tools are powerful solutions built for formal reporting, complete with auto-refresh capabilities and aesthetically pleasing visualizations. They are designed to cater to recurring use-cases and deliver comprehensive insights to stakeholders.
When to use:
Complex data visualization: When data requires in-depth analysis and sophisticated visual representation, production reporting tools shine with their advanced charting and graphing capabilities.
Scheduled and automated reporting: For recurring reports that need to be automatically refreshed and distributed, these tools offer scheduling options to ensure up-to-date information is readily available.
Data storytelling: Production reporting tools are perfect for presenting data in an engaging manner, enabling effective data storytelling to convey insights and drive decision-making.
In summary, by understanding the strengths of each method, businesses can make informed decisions to streamline their reporting processes and enhance data-driven decision-making.
Good News: I have experience in all of these methods! I’m currently open to roles in the business intelligence and data analytics space. As I consider my next play, I am also tackling project-base consulting work. If you'd like to connect or discuss potential collaborations, feel free to book some time with me at jehansaga.com/contact.


